
Not sure what accessibility changes will have the most benefit to your existing software? Are you in the build process and need to make sure accessibility has been appropriately considered? Use this checklist as a starting point.
Sometimes the inner workings of design agencies can seem a bit like a black box. There’s a lot of questions, and it can get pretty confusing pretty fast. Where does the time go? What are they working on, exactly? How many clients & projects are on the go?
And let’s face it: black boxes and confusion aren’t helpful to anyone. We’re big proponents of open, honest communication – in fact, it’s one of our core values. So let’s live it: we crunched some numbers from our previous month & designed a gorgeous infographic to share with you. From the infographic, you’ll learn how our time here at Paper Leaf is split up, how many projects (big, medium, and tiny) we touch during a month, and more. Take a look!
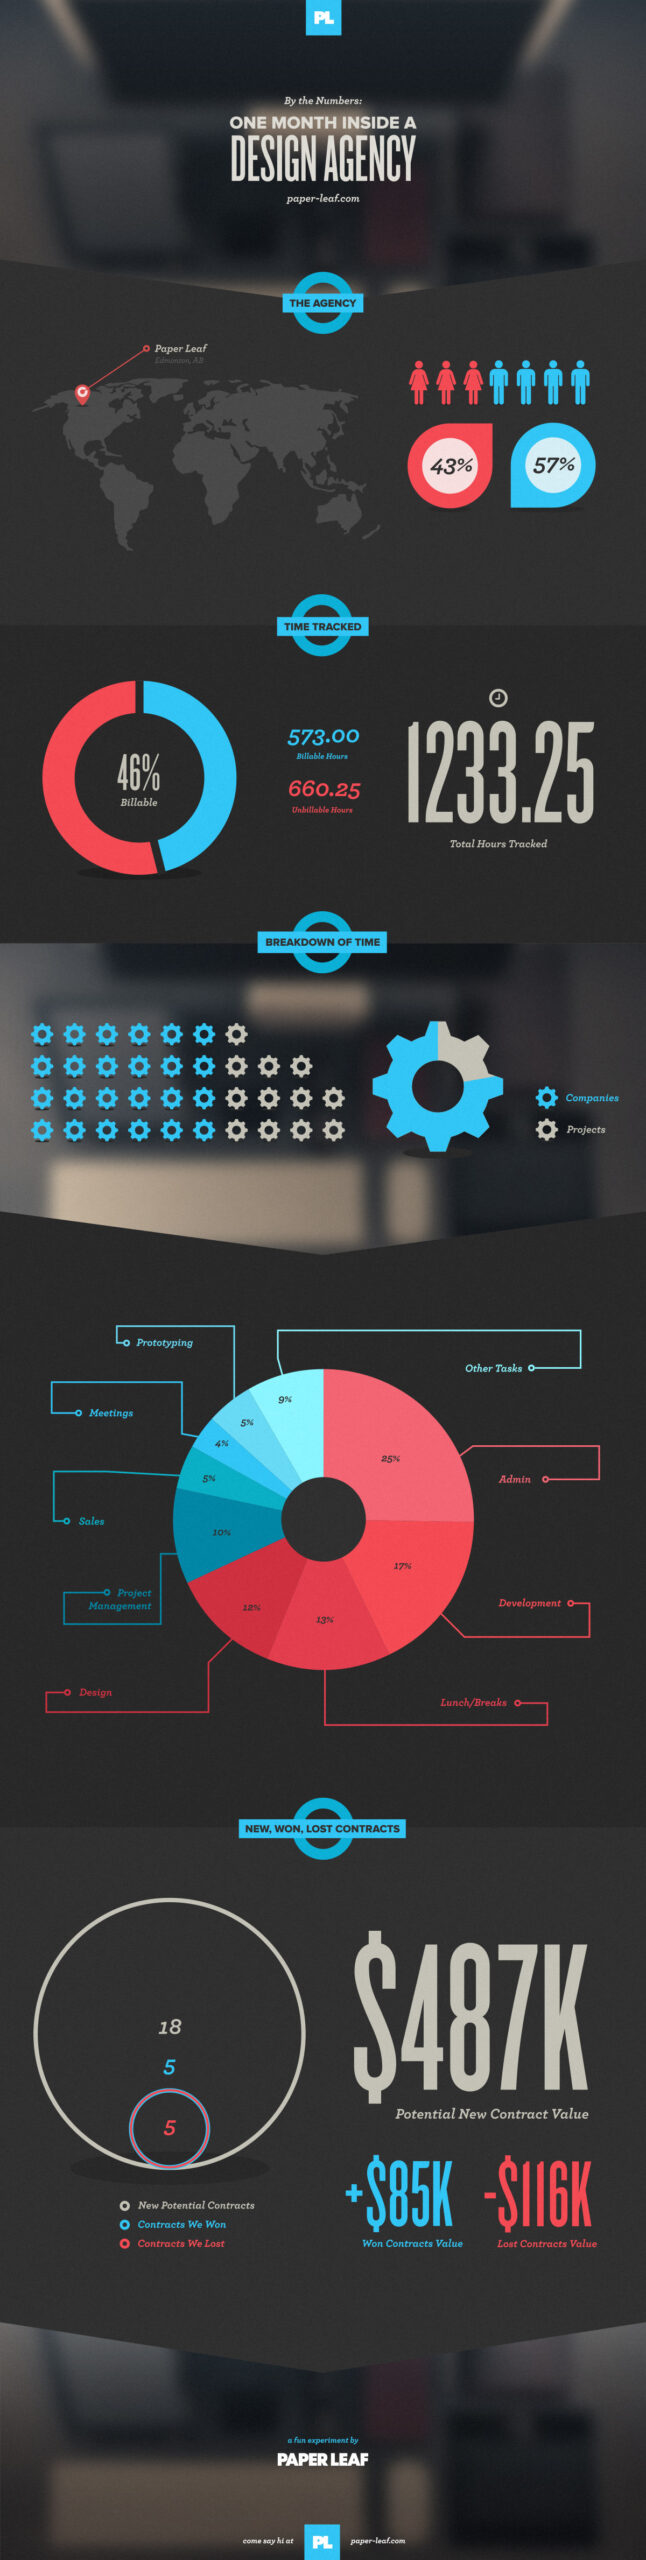
A Month in a Design Agency by the Numbers – An infographic by Jeff Archibald.
About the Data
Basically all the data here is taken from Harvest & Pipedrive, two tools we love. The data is fairly indicative of an average month at PL, with one big outlier: the potential new contract revenue. That is not normal. We’re not complaining, but it is an anomaly – we normally don’t get that volume of inquiries. If we did, Lindsay’s brain might melt.
Hopefully that gives you a bit of insight into a month at a 7-person, extraordinarily good-looking design agency. If you do want to share the infographic on your own site, the embed code is below!